


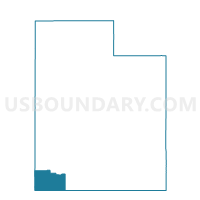
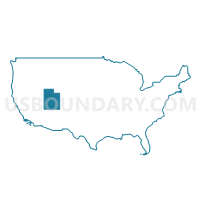
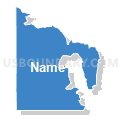
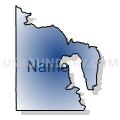
Census Tract 2703, Washington County, Utah
About
Outline

Summary
| Unique Area Identifier | 498627 |
| Name | Census Tract 2703 |
| County | Washington County |
| State | Utah |
| Area (square miles) | 674.55 |
| Land Area (square miles) | 674.11 |
| Water Area (square miles) | 0.45 |
| % of Land Area | 99.93 |
| % of Water Area | 0.07 |
| Latitude of the Internal Point | 37.20206640 |
| Longtitude of the Internal Point | -113.88752070 |
| Total Population | 8,148 |
| Total Housing Units | 3,096 |
| Total Households | 2,687 |
| Median Age | 33.8 |
Maps

Graphs
Select a template below for downloading or customizing gragh for Census Tract 2703, Washington County, Utah


Neighbors
Neighoring Census Tract (by Name) Neighboring Census Tract on the Map
- Census Tract 2702, Washington County, UT
- Census Tract 2704, Washington County, UT
- Census Tract 2705, Washington County, UT
- Census Tract 2706, Washington County, UT
- Census Tract 2707, Washington County, UT
- Census Tract 2708.02, Washington County, UT
- Census Tract 2712, Washington County, UT
- Census Tract 2713, Washington County, UT
- Census Tract 2714, Washington County, UT
- Census Tract 2715, Washington County, UT
- Census Tract 2716, Washington County, UT
- Census Tract 2717.02, Washington County, UT
- Census Tract 9501, Mohave County, AZ
- Census Tract 9501, Lincoln County, NV
- Census Tract 9502, Lincoln County, NV
Top 10 Neighboring County Subdivision (by Population) Neighboring County Subdivision on the Map
- St. George CCD, Washington County, UT (110,091)
- North Mohave CCD, Mohave County, AZ (10,851)
- Pioche CCD, Lincoln County, NV (2,684)
- Enterprise CCD, Washington County, UT (2,323)
- Caliente CCD, Lincoln County, NV (1,263)
Top 10 Neighboring Place (by Population) Neighboring Place on the Map
- St. George city, UT (72,897)
- Washington city, UT (18,761)
- Ivins city, UT (6,753)
- Santa Clara city, UT (6,003)
- Dammeron Valley CDP, UT (803)
- Veyo CDP, UT (483)
Top 10 Neighboring Unified School District (by Population) Neighboring Unified School District on the Map
- Washington School District, UT (138,115)
- Lincoln County School District, NV (5,345)
- Littlefield Unified District, AZ (3,930)
Top 10 Neighboring State Legislative District Lower Chamber (by Population) Neighboring State Legislative District Lower Chamber on the Map
- State House District 3, AZ (216,687)
- Assembly District 36, NV (59,012)
- State House District 71, UT (51,723)
- State House District 74, UT (47,422)
- State House District 75, UT (36,038)
Top 10 Neighboring State Legislative District Upper Chamber (by Population) Neighboring State Legislative District Upper Chamber on the Map
- State Senate District 3, AZ (216,687)
- State Senate District 29, UT (120,802)
- Rural Nevada Senatorial District, NV (97,335)
Top 10 Neighboring 111th Congressional District (by Population) Neighboring 111th Congressional District on the Map
- Congressional District 2, AZ (972,839)
- Congressional District 2, UT (890,993)
- Congressional District 2, NV (836,562)
Top 10 Neighboring 5-Digit ZIP Code Tabulation Area (by Population) Neighboring 5-Digit ZIP Code Tabulation Area on the Map
- 84770, UT (39,131)
- 84790, UT (35,770)
- 84780, UT (18,756)
- 84738, UT (6,878)
- 84765, UT (6,143)
- 86432, AZ (3,933)
- 84725, UT (1,964)
- 89008, NV (1,508)
- 84783, UT (805)
- 84782, UT (794)
Data
Demographic, Population, Households, and Housing Units
** Data sources from census 2010 **
Show Data on Map
Download Full List as CSV
Download Quick Sheet as CSV
| Subject | This Area | Washington County | Utah | National |
|---|---|---|---|---|
| POPULATION | ||||
| Total Population Map | 8,148 | 138,115 | 2,763,885 | 308,745,538 |
| POPULATION, HISPANIC OR LATINO ORIGIN | ||||
| Not Hispanic or Latino Map | 7,292 | 124,629 | 2,405,545 | 258,267,944 |
| Hispanic or Latino Map | 856 | 13,486 | 358,340 | 50,477,594 |
| POPULATION, RACE | ||||
| White alone Map | 7,249 | 123,914 | 2,379,560 | 223,553,265 |
| Black or African American alone Map | 93 | 790 | 29,287 | 38,929,319 |
| American Indian and Alaska Native alone Map | 193 | 1,869 | 32,927 | 2,932,248 |
| Asian alone Map | 51 | 982 | 55,285 | 14,674,252 |
| Native Hawaiian and Other Pacific Islander alone Map | 43 | 1,078 | 24,554 | 540,013 |
| Some Other Race alone Map | 384 | 6,313 | 166,754 | 19,107,368 |
| Two or More Races Map | 135 | 3,169 | 75,518 | 9,009,073 |
| POPULATION, SEX | ||||
| Male Map | 4,068 | 68,292 | 1,388,317 | 151,781,326 |
| Female Map | 4,080 | 69,823 | 1,375,568 | 156,964,212 |
| POPULATION, AGE (18 YEARS) | ||||
| 18 years and over Map | 5,929 | 96,429 | 1,892,858 | 234,564,071 |
| Under 18 years | 2,219 | 41,686 | 871,027 | 74,181,467 |
| POPULATION, AGE | ||||
| Under 5 years | 557 | 12,410 | 263,924 | 20,201,362 |
| 5 to 9 years | 520 | 11,893 | 249,572 | 20,348,657 |
| 10 to 14 years | 619 | 10,987 | 227,951 | 20,677,194 |
| 15 to 17 years | 523 | 6,396 | 129,580 | 12,954,254 |
| 18 and 19 years | 411 | 4,262 | 91,510 | 9,086,089 |
| 20 years | 132 | 1,832 | 42,204 | 4,519,129 |
| 21 years | 114 | 1,771 | 45,173 | 4,354,294 |
| 22 to 24 years | 376 | 5,528 | 139,142 | 12,712,576 |
| 25 to 29 years | 488 | 9,330 | 229,554 | 21,101,849 |
| 30 to 34 years | 420 | 8,690 | 216,133 | 19,962,099 |
| 35 to 39 years | 367 | 7,212 | 178,401 | 20,179,642 |
| 40 to 44 years | 402 | 6,531 | 154,074 | 20,890,964 |
| 45 to 49 years | 448 | 6,581 | 154,831 | 22,708,591 |
| 50 to 54 years | 409 | 6,851 | 152,133 | 22,298,125 |
| 55 to 59 years | 468 | 6,817 | 133,122 | 19,664,805 |
| 60 and 61 years | 212 | 2,912 | 46,154 | 7,113,727 |
| 62 to 64 years | 342 | 4,286 | 60,965 | 9,704,197 |
| 65 and 66 years | 222 | 2,827 | 34,485 | 5,319,902 |
| 67 to 69 years | 256 | 4,071 | 44,995 | 7,115,361 |
| 70 to 74 years | 354 | 5,894 | 58,744 | 9,278,166 |
| 75 to 79 years | 254 | 4,780 | 45,835 | 7,317,795 |
| 80 to 84 years | 143 | 3,408 | 34,412 | 5,743,327 |
| 85 years and over | 111 | 2,846 | 30,991 | 5,493,433 |
| MEDIAN AGE BY SEX | ||||
| Both sexes Map | 33.80 | 32.50 | 29.20 | 37.20 |
| Male Map | 32.50 | 31.40 | 28.70 | 35.80 |
| Female Map | 35.50 | 33.80 | 29.70 | 38.50 |
| HOUSEHOLDS | ||||
| Total Households Map | 2,687 | 46,334 | 877,692 | 116,716,292 |
| HOUSEHOLDS, HOUSEHOLD TYPE | ||||
| Family households: Map | 1,982 | 35,447 | 660,234 | 77,538,296 |
| Husband-wife family Map | 1,677 | 29,951 | 535,827 | 56,510,377 |
| Other family: Map | 305 | 5,496 | 124,407 | 21,027,919 |
| Male householder, no wife present Map | 94 | 1,616 | 38,858 | 5,777,570 |
| Female householder, no husband present Map | 211 | 3,880 | 85,549 | 15,250,349 |
| Nonfamily households: Map | 705 | 10,887 | 217,458 | 39,177,996 |
| Householder living alone Map | 517 | 8,702 | 164,018 | 31,204,909 |
| Householder not living alone Map | 188 | 2,185 | 53,440 | 7,973,087 |
| HOUSEHOLDS, HISPANIC OR LATINO ORIGIN OF HOUSEHOLDER | ||||
| Not Hispanic or Latino householder: Map | 2,497 | 43,329 | 793,895 | 103,254,926 |
| Hispanic or Latino householder: Map | 190 | 3,005 | 83,797 | 13,461,366 |
| HOUSEHOLDS, RACE OF HOUSEHOLDER | ||||
| Householder who is White alone | 2,504 | 43,236 | 785,761 | 89,754,352 |
| Householder who is Black or African American alone | 17 | 191 | 8,252 | 14,129,983 |
| Householder who is American Indian and Alaska Native alone | 38 | 430 | 9,152 | 939,707 |
| Householder who is Asian alone | 8 | 263 | 16,474 | 4,632,164 |
| Householder who is Native Hawaiian and Other Pacific Islander alone | 8 | 275 | 5,253 | 143,932 |
| Householder who is Some Other Race alone | 85 | 1,424 | 39,501 | 4,916,427 |
| Householder who is Two or More Races | 27 | 515 | 13,299 | 2,199,727 |
| HOUSEHOLDS, HOUSEHOLD TYPE BY HOUSEHOLD SIZE | ||||
| Family households: Map | 1,982 | 35,447 | 660,234 | 77,538,296 |
| 2-person household Map | 971 | 15,744 | 222,850 | 31,882,616 |
| 3-person household Map | 322 | 5,839 | 130,366 | 17,765,829 |
| 4-person household Map | 254 | 5,429 | 126,309 | 15,214,075 |
| 5-person household Map | 184 | 3,987 | 88,513 | 7,411,997 |
| 6-person household Map | 128 | 2,497 | 52,732 | 3,026,278 |
| 7-or-more-person household Map | 123 | 1,951 | 39,464 | 2,237,501 |
| Nonfamily households: Map | 705 | 10,887 | 217,458 | 39,177,996 |
| 1-person household Map | 517 | 8,702 | 164,018 | 31,204,909 |
| 2-person household Map | 103 | 1,466 | 34,119 | 6,360,012 |
| 3-person household Map | 27 | 377 | 9,684 | 992,156 |
| 4-person household Map | 28 | 199 | 6,145 | 411,171 |
| 5-person household Map | 16 | 82 | 1,688 | 126,634 |
| 6-person household Map | 11 | 46 | 1,457 | 48,421 |
| 7-or-more-person household Map | 3 | 15 | 347 | 34,693 |
| HOUSING UNITS | ||||
| Total Housing Units Map | 3,096 | 57,734 | 979,709 | 131,704,730 |
| HOUSING UNITS, OCCUPANCY STATUS | ||||
| Occupied Map | 2,687 | 46,334 | 877,692 | 116,716,292 |
| Vacant Map | 409 | 11,400 | 102,017 | 14,988,438 |
| HOUSING UNITS, OCCUPIED, TENURE | ||||
| Owned with a mortgage or a loan Map | 1,210 | 22,198 | 471,931 | 52,979,430 |
| Owned free and clear Map | 606 | 10,445 | 146,206 | 23,006,644 |
| Renter occupied Map | 871 | 13,691 | 259,555 | 40,730,218 |
| HOUSING UNITS, VACANT, VACANCY STATUS | ||||
| For rent Map | 79 | 1,434 | 20,176 | 4,137,567 |
| Rented, not occupied Map | 4 | 79 | 1,408 | 206,825 |
| For sale only Map | 76 | 1,467 | 14,580 | 1,896,796 |
| Sold, not occupied Map | 14 | 201 | 2,828 | 421,032 |
| For seasonal, recreational, or occasional use Map | 160 | 7,201 | 47,978 | 4,649,298 |
| For migrant workers Map | 0 | 10 | 232 | 24,161 |
| Other vacant Map | 76 | 1,008 | 14,815 | 3,652,759 |
| HOUSING UNITS, OCCUPIED, AVERAGE HOUSEHOLD SIZE BY TENURE | ||||
| Total: Map | 2.86 | 2.94 | 3.10 | 2.58 |
| Owner occupied Map | 2.87 | 2.84 | 3.21 | 2.65 |
| Renter occupied Map | 2.83 | 3.17 | 2.82 | 2.44 |
| HOUSING UNITS, OCCUPIED, TENURE BY RACE OF HOUSEHOLDER | ||||
| Owner occupied: Map | 1,816 | 32,643 | 618,137 | 75,986,074 |
| Householder who is White alone Map | 1,750 | 31,411 | 572,530 | 63,446,275 |
| Householder who is Black or African American alone Map | 4 | 59 | 2,896 | 6,261,464 |
| Householder who is American Indian and Alaska Native alone Map | 23 | 146 | 4,825 | 509,588 |
| Householder who is Asian alone Map | 4 | 165 | 10,203 | 2,688,861 |
| Householder who is Native Hawaiian and Other Pacific Islander alone Map | 0 | 107 | 2,469 | 61,911 |
| Householder who is Some Other Race alone Map | 19 | 513 | 18,506 | 1,975,817 |
| Householder who is Two or More Races Map | 16 | 242 | 6,708 | 1,042,158 |
| Renter occupied: Map | 871 | 13,691 | 259,555 | 40,730,218 |
| Householder who is White alone Map | 754 | 11,825 | 213,231 | 26,308,077 |
| Householder who is Black or African American alone Map | 13 | 132 | 5,356 | 7,868,519 |
| Householder who is American Indian and Alaska Native alone Map | 15 | 284 | 4,327 | 430,119 |
| Householder who is Asian alone Map | 4 | 98 | 6,271 | 1,943,303 |
| Householder who is Native Hawaiian and Other Pacific Islander alone Map | 8 | 168 | 2,784 | 82,021 |
| Householder who is Some Other Race alone Map | 66 | 911 | 20,995 | 2,940,610 |
| Householder who is Two or More Races Map | 11 | 273 | 6,591 | 1,157,569 |
| HOUSING UNITS, OCCUPIED, TENURE BY HISPANIC OR LATINO ORIGIN OF HOUSEHOLDER | ||||
| Owner occupied: Map | 1,816 | 32,643 | 618,137 | 75,986,074 |
| Not Hispanic or Latino householder Map | 1,763 | 31,372 | 575,835 | 69,617,625 |
| Hispanic or Latino householder Map | 53 | 1,271 | 42,302 | 6,368,449 |
| Renter occupied: Map | 871 | 13,691 | 259,555 | 40,730,218 |
| Not Hispanic or Latino householder Map | 734 | 11,957 | 218,060 | 33,637,301 |
| Hispanic or Latino householder Map | 137 | 1,734 | 41,495 | 7,092,917 |
| HOUSING UNITS, OCCUPIED, TENURE BY HOUSEHOLD SIZE | ||||
| Owner occupied: Map | 1,816 | 32,643 | 618,137 | 75,986,074 |
| 1-person household Map | 275 | 5,624 | 94,206 | 16,453,569 |
| 2-person household Map | 836 | 13,878 | 188,793 | 27,618,605 |
| 3-person household Map | 218 | 3,975 | 96,780 | 12,517,563 |
| 4-person household Map | 176 | 3,576 | 96,305 | 10,998,793 |
| 5-person household Map | 128 | 2,594 | 69,008 | 5,057,765 |
| 6-person household Map | 92 | 1,719 | 42,286 | 1,965,796 |
| 7-or-more-person household Map | 91 | 1,277 | 30,759 | 1,373,983 |
| Renter occupied: Map | 871 | 13,691 | 259,555 | 40,730,218 |
| 1-person household Map | 242 | 3,078 | 69,812 | 14,751,340 |
| 2-person household Map | 238 | 3,332 | 68,176 | 10,624,023 |
| 3-person household Map | 131 | 2,241 | 43,270 | 6,240,422 |
| 4-person household Map | 106 | 2,052 | 36,149 | 4,626,453 |
| 5-person household Map | 72 | 1,475 | 21,193 | 2,480,866 |
| 6-person household Map | 47 | 824 | 11,903 | 1,108,903 |
| 7-or-more-person household Map | 35 | 689 | 9,052 | 898,211 |
Loading...